
The Only Four Numbers You Need to Analyze a Stock
Aug 31, 2025Hello Stoic Investors,
If you had to measure the time it takes you to analyze whether a stock is a good investment or not, how long would you say it takes?
Five minutes? An hour? A whole afternoon?
I’ve asked myself that same question—and I can tell you with confidence that for me, it never takes more than 30 seconds!
I know, I know—30 seconds sounds ridiculously fast.
But the truth is, after years of practice, I’ve trained myself to ignore all the noise, the endless numbers that only confuse the picture, and instead focus on just a handful of metrics that actually matter.
That’s why I can make an initial judgment so quickly.
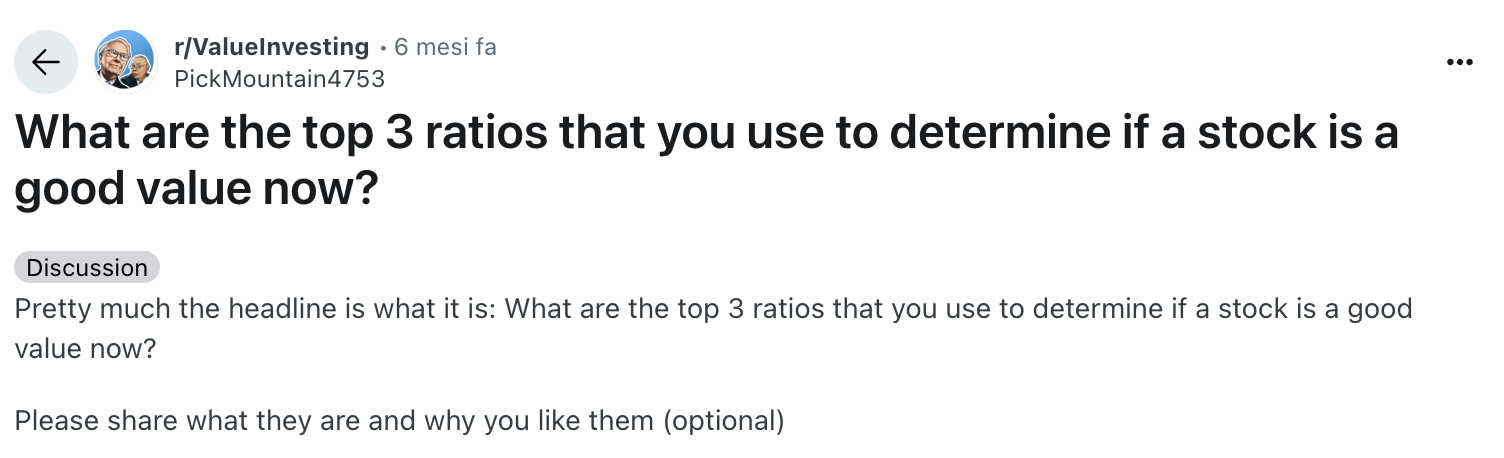
Recently I came across a Reddit post where someone asked investors to share their three favorite ratios when analyzing stocks.
I liked the idea, but I couldn’t resist going one step further.
Instead of three, I’ll share with you the FOUR ratios I always use!
1. EV/EBITDA ratio < 20
I like to start with the EV/EBITDA ratio because it immediately tells me if I’m paying too much for a company’s profits.
EV/EBITDA stands for “Enterprise Value to Earnings Before Interest, Taxes, Depreciation, and Amortization.”
It might sound complex, but all it really tells you is whether a company is expensive or cheap compared to how much money it actually makes from its core business.
A lower number is always better, because it means you’re paying less for each pound of profit.
To give you an example, Amazon’s EV/EBITDA ratio is around 17.8, which makes it fairly priced, while AMD sits around 48—meaning it’s expensive compared to its earnings.
2. Gross margin > 50%
Gross margin is one of my favorites because it shows how much profit a company keeps from its core operations—an instant measure of efficiency.
This metric tells you how much profit remains after covering the direct costs of producing goods or services.
For example, if you sell a phone for £100 and it costs you £40 to make, your gross margin is 60%.
The higher the margin, the stronger and healthier the business.
Nvidia, for example, has a gross margin of about 73.5% in its most recent fiscal reporting, showing that it keeps a large share of profit from every sale.
3. Price to Free Cash Flow < 20
I pay close attention to Price to Free Cash Flow because it shows the real money a company generates—the cash that can be reinvested or returned to shareholders.
Free cash flow is the actual money a company has left after paying for its operations and investments.
A lower P/FCF ratio means you’re paying less for each pound of real cash the company produces, which is much safer than relying on accounting profits alone.
4. PEG ratio < 2
Finally, the PEG ratio is one of my favorites because it links a stock’s current price to its future growth, helping me see if I’m buying a bargain or overpaying.
PEG stands for Price to Earnings Growth, and it considers how fast the company is expected to grow.
A lower PEG means you’re getting more growth for the price you pay.
For instance, Meta’s PEG is about 2.4, which is a bit high, while Apple’s PEG is about 2.0, which is fairly balanced.
And that’s it—these are my absolute favorite ratios when analyzing a stock!
So, note down these 4 key-numbers and start investing today:
1. EV/EBITDA < 20: Shows if the stock is fairly priced compared to its profits;
2. Gross Margin > 50%: Tells you how much profit the company keeps from its sales;
3. Price to Free Cash Flow < 20: Measures the real cash the company generates;
4. PEG Ratio < 2: Connects the price you pay today to the company’s expected growth.